Cristiano Ronaldo's Home vs. Away Scoring Efficiency
Cristiano Ronaldo's scoring record can be examined not only through his total goals, but also through where he plays and how frequently he scores relative to his playing time. This analysis compares his home and away scoring output, explores differences across competitions and teams, and uses goals per 90 minutes to provide additional context.
Goals by Venue
This visualization compares Ronaldo's total goals scored at home, away, and at neutral venues.
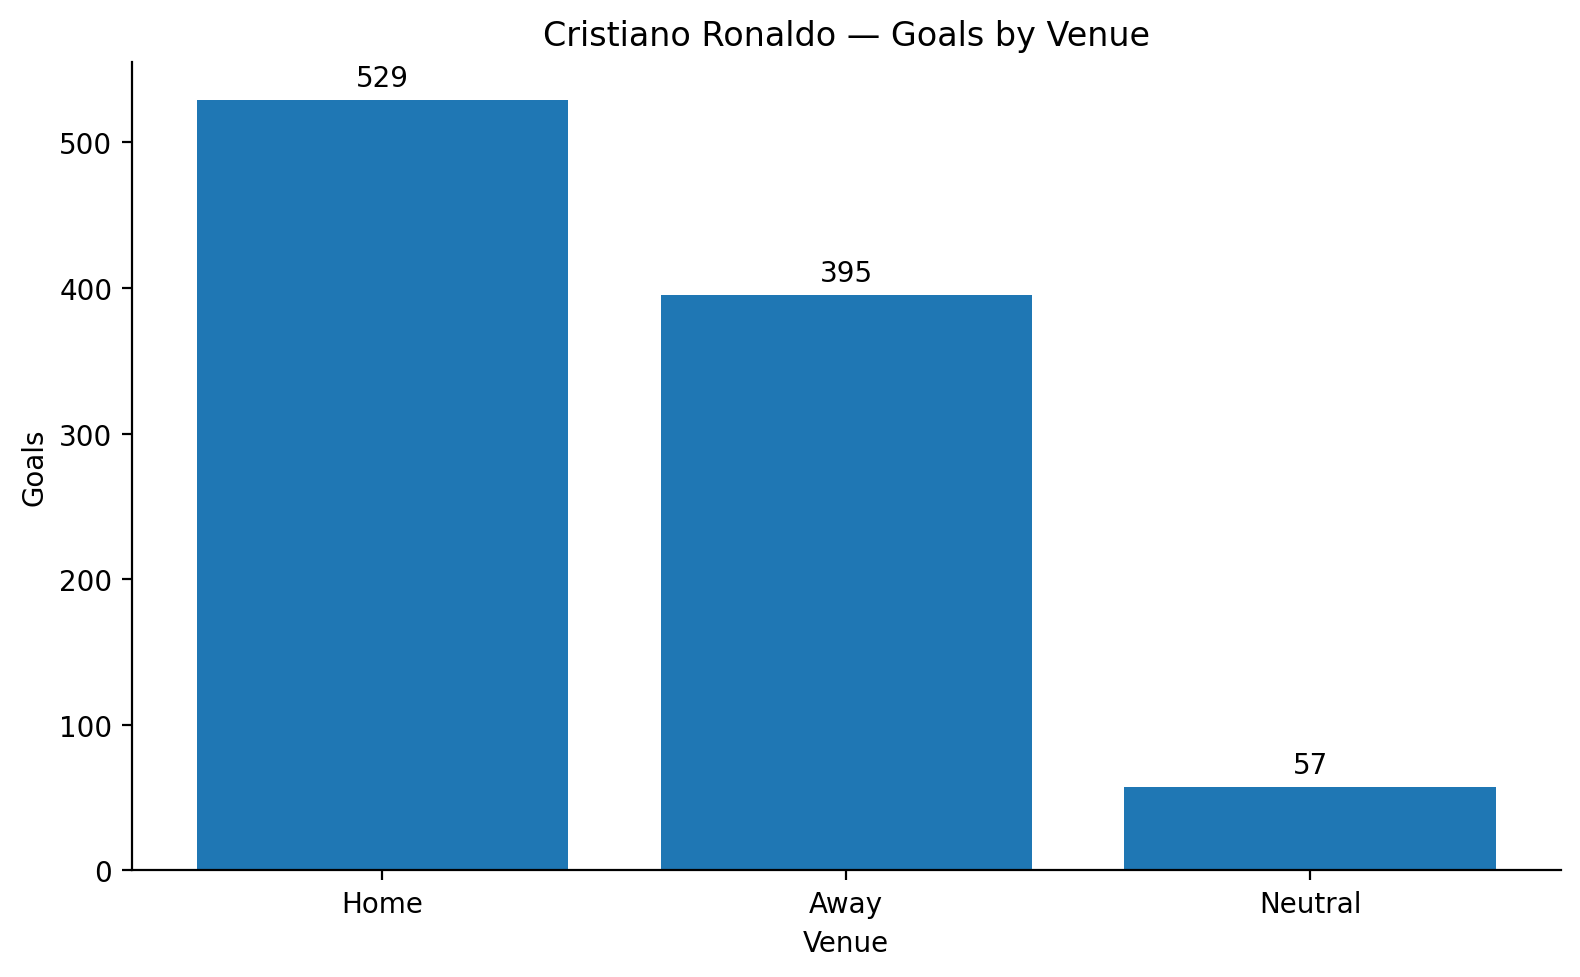
This visualization shows the raw statistics for goals by venue. He has scored the most goals at home, followed by away, and then neutral venues. However, this does not account for differences in playing time or the number of matches played in each venue type. Of course, venues can play an impact because it is easier for a team to score while playing at home; however, his away goal tally is remarkable at 395 away goals thus far.
Goals per 90 Minutes by Venue
Raw goal totals do not account for differences in playing time. This visualization compares Ronaldo's goals per 90 minutes at home, away, and at neutral venues.
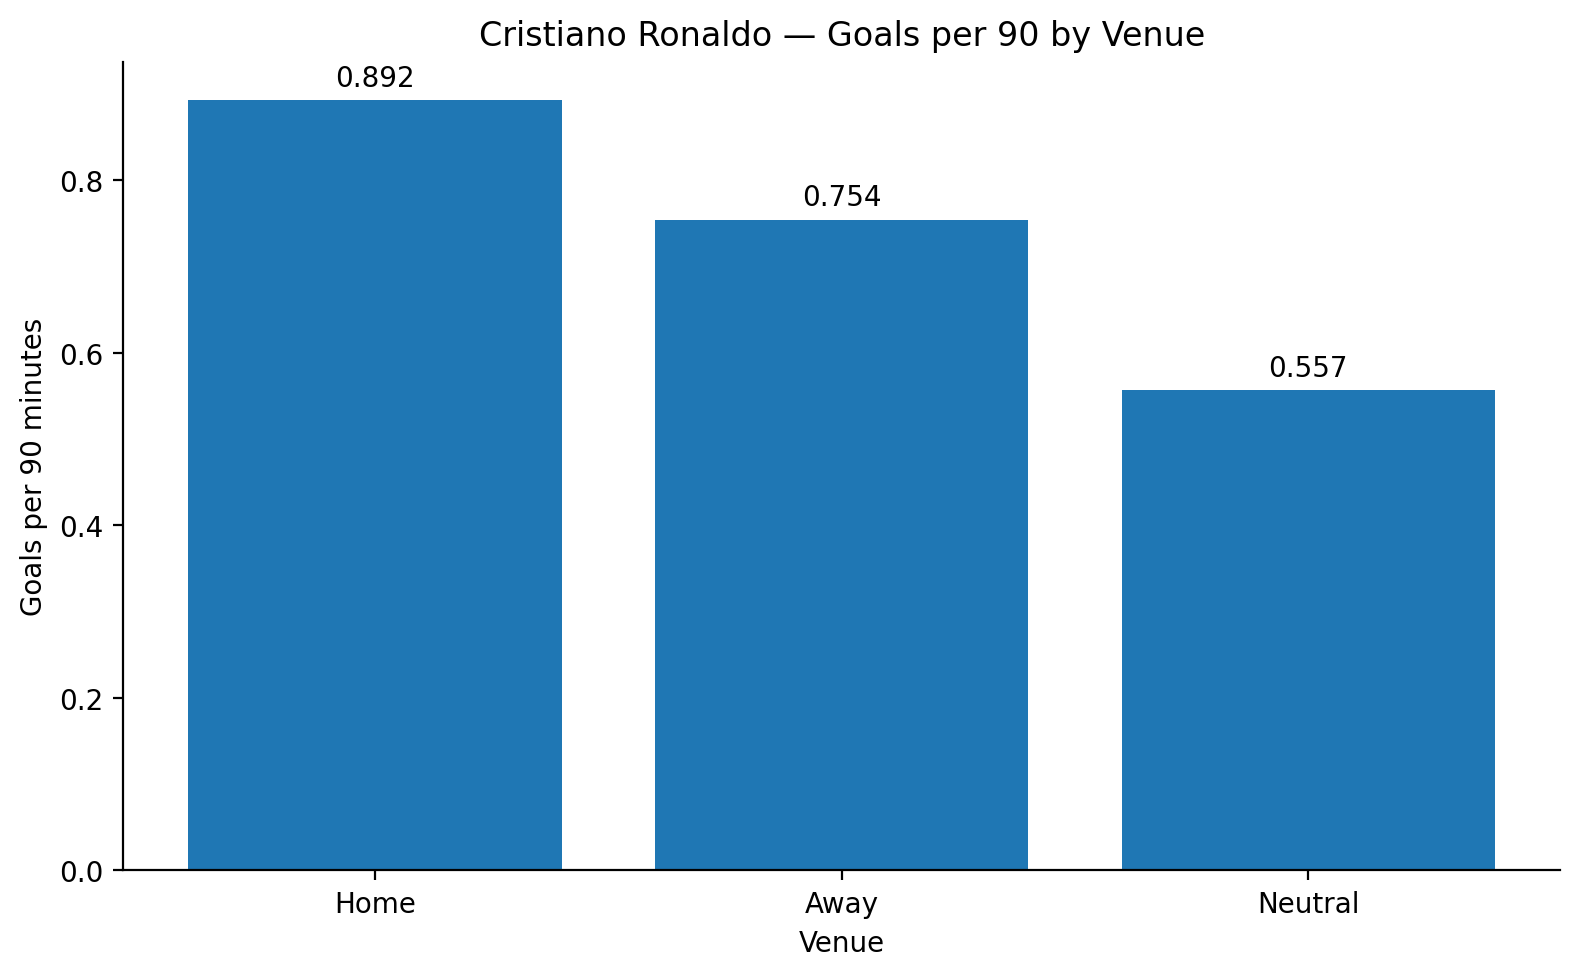
The bar graph shows the difference in goals per 90 minutes decreasing as the venue goes from home to away. Regardless, 0.754 goals per 90 in away games is incredible. Since we already know scoring in away games is a tougher task, this is a remarkable statistic. Also, neutral games are played in a variety of locations, so the scoring rate is likely affected by the specific venues and conditions of those matches. It could be rightfully speculated that the goal ratio is dependent on fan turnout, as well as the quality of the opposition.
Goal Distribution by Competition
Ronaldo has played in numerous domestic leagues, cup competitions, and international tournaments. This visualization compares his recorded home and away goal totals across competitions.
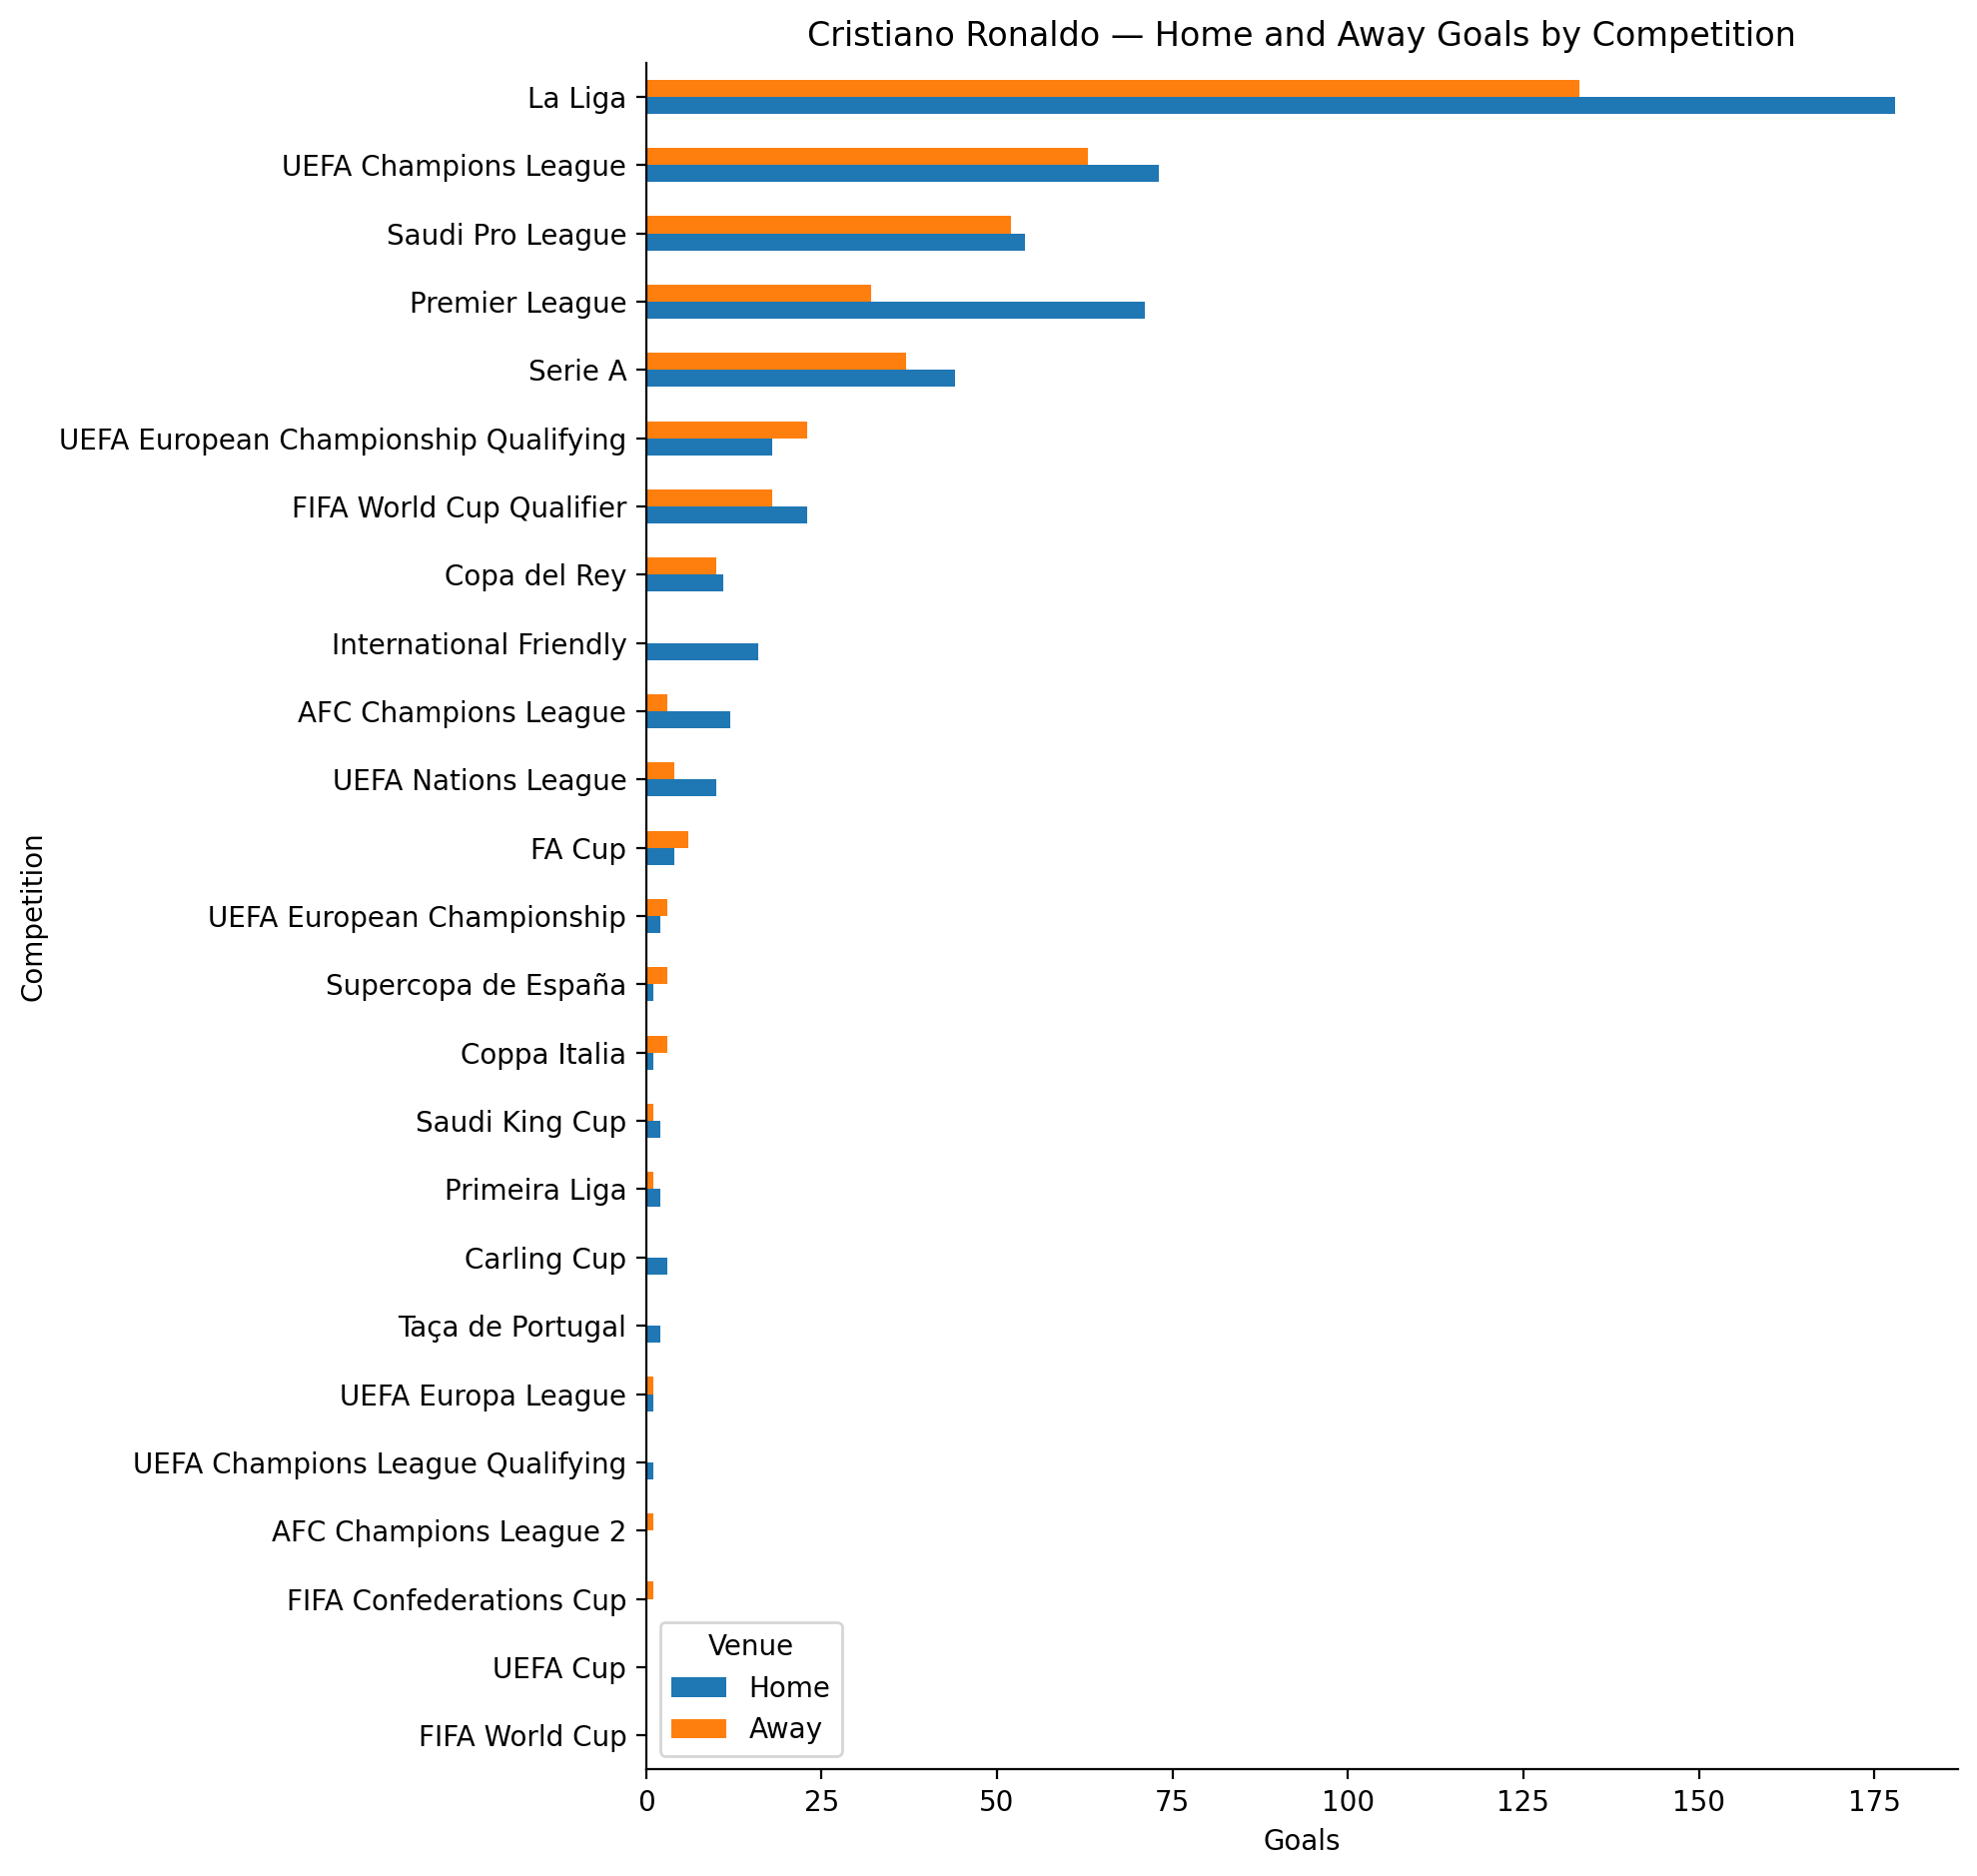
This graph shows that La Liga is the competition in which he has scored the most goals, with a clear gap, followed by the Champions League and other competitions. Of course, most competitions show his goals being higher in home than away games. Impressively, he has scored more away goals than home goals in UEFA EURO Qualifier matches.
Home and Away Scoring by Team
Ronaldo's career has included several clubs and the Portugal national team. This visualization compares his home and away goal totals and scoring rates for each team.
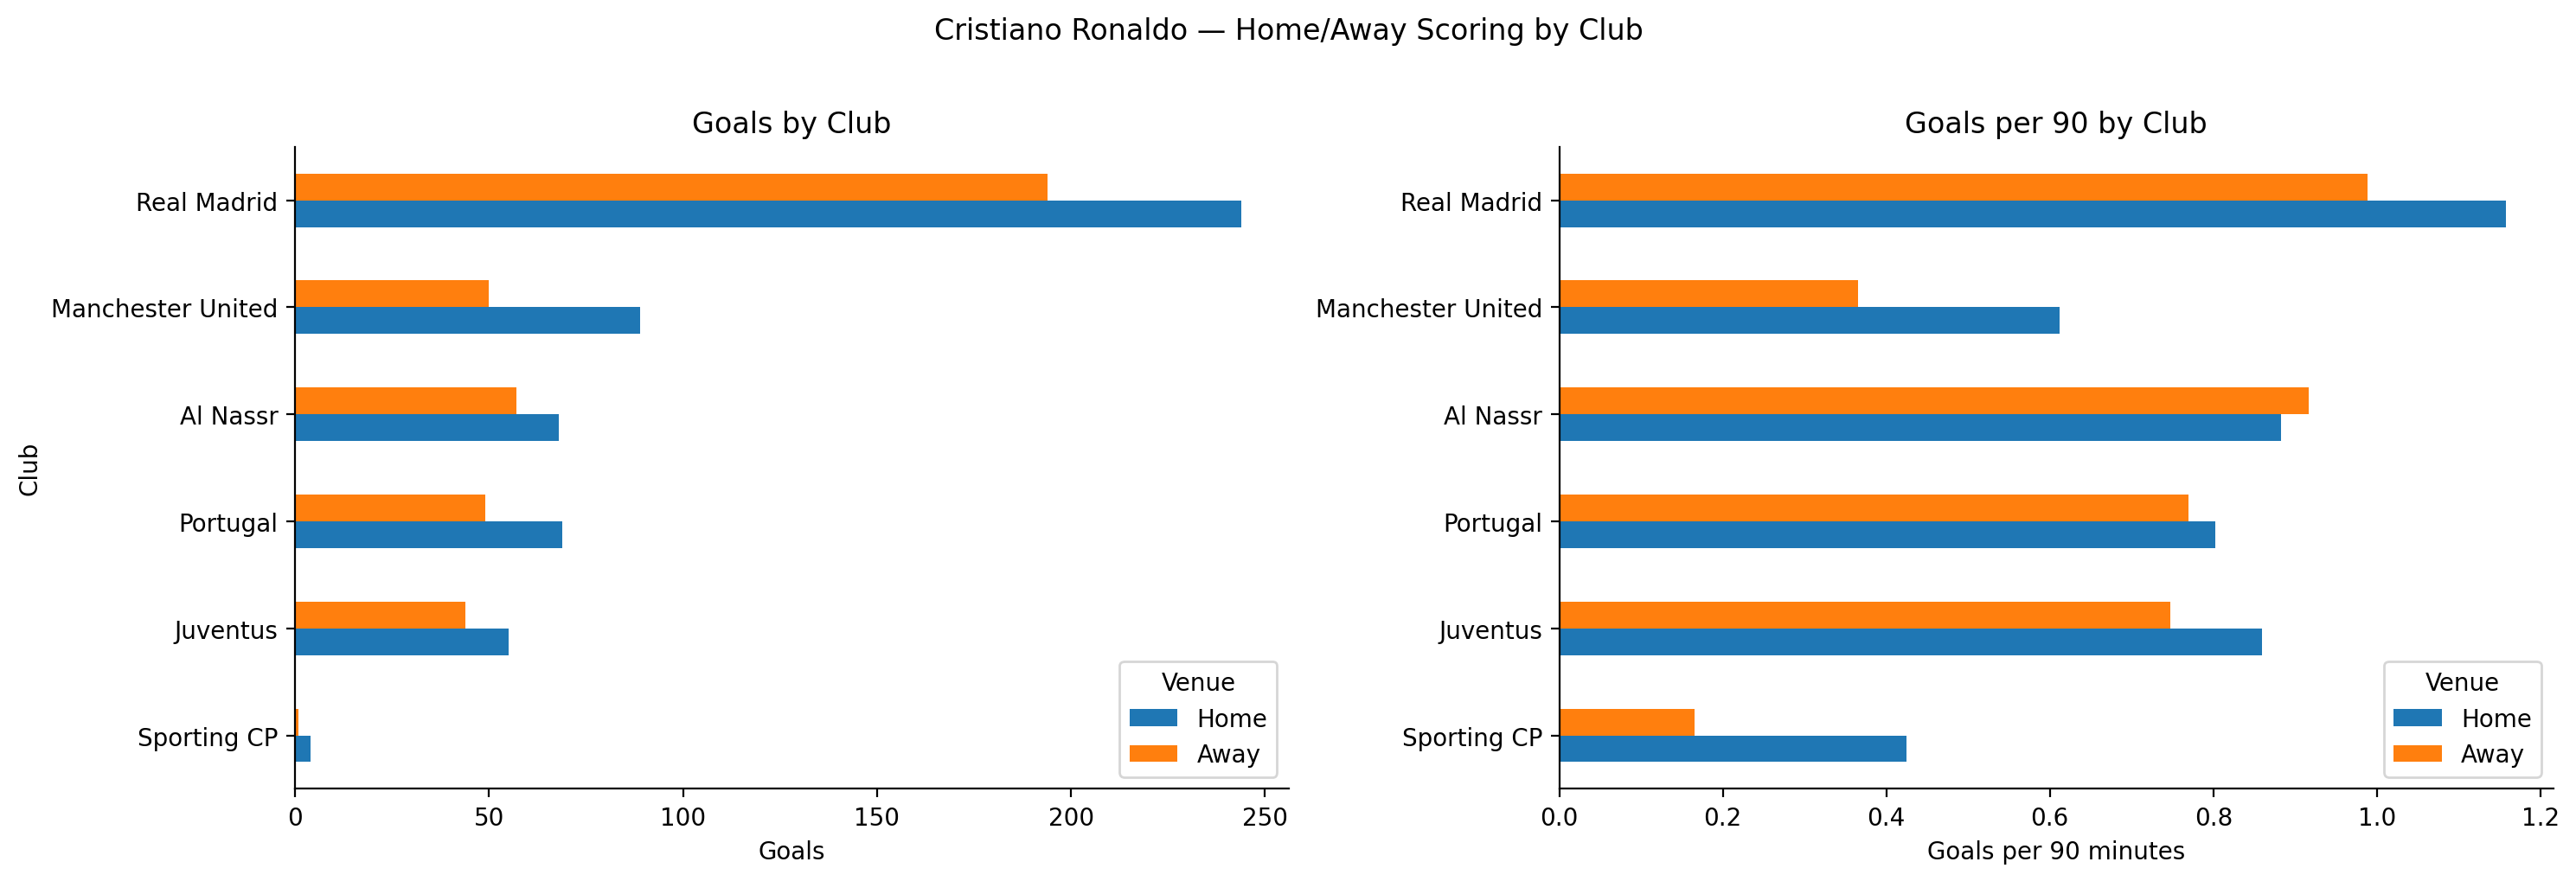
Finally, Cristiano Ronaldo's goals by venue can be broken down by club. The left panel shows raw goal totals while the right panel shows goals per 90 minutes. The main focus here is the per 90 rate, which shows some key things. For example, his scoring rate in home games for Sporting is slightly higher than his scoring rate in away games for Manchester United. Additionally, his scoring rate in home and away games for Juventus, Portugal, and Al-Nassr fall between 0.75 and 0.92. To add, his scoring rate in away games for Al-Nassr is higher than his scoring rate in home games. Both scoring rates for Real Madrid are above 1.0, given that he averaged slightly over a goal per game. Overall, this visualization shows that Ronaldo has been a prolific scorer regardless of venue, competition, or team.
Methodology and Limitations
This analysis uses the match logs recorded in The Ronaldo Archive. Goals per 90 minutes is calculated by dividing recorded goals by recorded minutes played and multiplying by 90. The rate calculations use matches with valid recorded minutes, so incomplete playing-time data may affect the results. Neutral venues are included in the first two visualizations but excluded from the competition and team comparisons. Complete shot data is not available across Ronaldo's career, so shot-conversion rate is not calculated. Goals per 90 minutes measures scoring rate, not the proportion of shots converted.